Kevin MacCauley is the Founder & CEO of Upper Hand which is a software that helps to streamline all aspects of business operations in sports and fitness. He recognized a need for a scheduling software when he was coaching Little League and he used the skills he learned in previous jobs to grow the company to much more than just scheduling and to winning many tech awards in Indy. In this episode, you’ll hear Kevin tell us about the progression of his career and how a lot of his success relates back to the first job he had out of college and the skills he learned there, his love for books and learning and a ton of great book suggestions he has for us, and his company Upper Hand and how it’s evolved to what it is today.

Keeping track of how well the KPIs for sports business are performing can be a very nebulous task. There are so many different factors that go into defining what makes a business “successful” that it can feel difficult to even come up with a roadmap that gets you close to knowing if your business is healthy or needs improvement. Luckily we live in the information age, where data is at pretty much everyone’s fingertips. Whether it be a small business keeping track of revenue on Microsoft Excel or Google storing terabytes worth of data every second in a massive data warehouse, it’s no secret that data is one of the most important aspects of 21st century business.
However, one of the most confusing hurdles for businesses that have data is figuring out how to use it in an effective manner. One such way to use data to your business’s advantage is through metrics called Key Performance Indicators. These are generally one-number metrics that communicate a certain aspect of the business in a simple and straightforward way. They go beyond something simple like revenue or total clients, usually adding in another variable to produce a metric that can tell more than the sum of its parts. There are plenty of these KPIs that businesses can employ to understand their business on a deeper level, and here are some that we at Upper Hand think could be very useful to you and your business!
#5: Customer Lifetime Value
(How Much is One Customer Worth?)
More than any of the other KPIs for sports businesses on this list, Customer Lifetime Value is focused more on projections than capturing the current status of your business. Just because it’s not like the others doesn’t mean that it isn’t very useful though! Customer Lifetime Value is used to project how much money you expect a customer to spend with you. It’s very useful for understanding the long-term revenue that a single customer could bring to your business and assessing how long you expect customers to stay with your business.
The method for calculating this is also unlike the other KPIs on this list as it involves coming up with a figure that’s used in the formula. In order to calculate CLV you’re going to need to come up with a timeframe that the customer is likely to spend with your business. So if this is a membership based gym that might be the length of their most popular membership but if it’s something like a yoga studio it might be a few classes. The other variable involved in this calculation is just how much money that the average person spends during the time span that you’ve set. Then divide the two and you’ve got the customer’s estimated lifetime value.
On top of giving information about the amount of money that you can reasonably expect a customer to give you over a certain amount of time, this KPI can also help you understand how your business could grow in the future.
#4: Revenue per Square Foot
(For the Facility Owner)
Like Cost Per Click, this KPI can only be calculated if you have a facility where a majority of a business’s revenue gets generated. That being said, it is also just as crucial as a metric like CPC is to tracking online marketing. For businesses that generate most of their revenue through a facility, making sure that the facility is optimized should be one of their biggest priorities. That’s where Revenue Per Square Foot comes in, as it allows you to see just how much of your workspace is being converted into valuable revenue.
It is yet another very straightforward calculation as well, with it just being the total revenue that you’ve made divided by the square footage of your building. The result should be a dollar amount that puts a dollar amount on each square foot of business that you have available to you. As with most of the revenue numbers generally the higher of a number that you come out with the better that your business is doing. Maybe there’s a resource that you’re not using well enough or there’s just space in your building that isn’t being used at all, but with Revenue Per Square Foot you should be able to find all of this out!
#3: Cost per Click
(The KPIs for Sports Business Social Media)
Out of all of the KPIs on this list, this one is probably the most complicated to figure out since you would only have access to the information necessary if you kept track of your impressions on social media. But… for businesses that work a lot in the social media world, there isn’t a better way to visualize your return on investment.
Whether its for ads that you run on Google or a company Instagram account, all of the ways that you take your business online will lead to impressions and most importantly: clicks. These clicks indicate how many times that someone interacts with your business on the web, and once someone clicks in you have their oh-so valuable attention. Now of course the method by which you attain said clicks is not generally free, so this is where understanding how much money it costs to obtain these impressions is very valuable. While these clicks are very important to get in the online world, you shouldn’t be neglecting the cost that it takes to get them.
Much like the other KPI’s on this list once you have the data it isn’t very hard to compute, as you’re just taking the total amount spent on ads or campaigns and dividing it by the total number of clicks that you’ve accumulated. It’s up to each individual business to define what kind of clicks that want to track, but other than that it’s a pretty straightforward formula. As mentioned earlier this KPI can only be utilized if you have access to/ keep track of this kind of data, and if you can’t, maybe this will be an inspiration for you to start keeping track of it!
#2: Customer Retention
(Keep them Coming Back)
Customer retention is a very important metric to keep track of because it’s a very straightforward way to check the sustainability of your business model. Customers are the lifeblood of business, and seeing how well someone is doing at keeping their customers coming back can be very telling about how your business will do in the long haul. If revenue per client is an indicator of how much money someone is making per client they have, then customer retention is an indicator of how often one can expect a customer to come back and contribute revenue.
On top of the value of the information this KPI gives, it’s also very versatile and can be used to fit a variety of business models. For example, a “customer” can mean a lot of different things across the sports industry. If you’re a retail store that sells equipment, a customer can just be someone who comes in and buys something, and customer retention would be seeing if that person comes in again and buys something. But if you’re a membership based gym, customer retention would be calculated more along the lines of having someone renew their membership at the end of its duration instead of moving on to another gym. There’s also a value in the simplicity of this KPI since a higher number is always going to be better for your business.
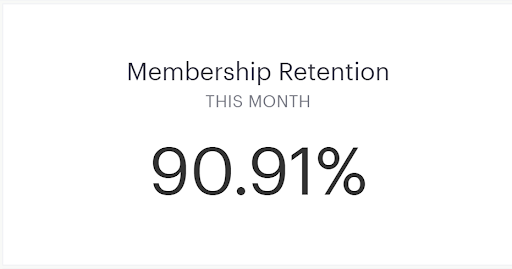
As seen above this business is keeping 91% of the members from one month to the next. As mentioned above this can mean a lot of different things to a lot of companies but it’s good that it’s in the 90’s.
#1: Revenue per Client
(The Gold Standard)
This metric is probably one of the most common and straightforward when it comes to KPIs, as it kind of explains itself (and also how to calculate it). Just because it’s simple doesn’t mean it isn’t valuable though! Revenue and number of clients are arguably two of the most important factors when considering the state of a business and when you look at how they intersect with each other can lead to a better understanding of one’s business. Another great aspect of this KPI is that it is very easy to calculate. This number is created by simply taking the total revenue that you make and dividing it by the number of clients you have. The result is a dollar amount that represents how much money you are expected to make per client that your business has, as seen below.
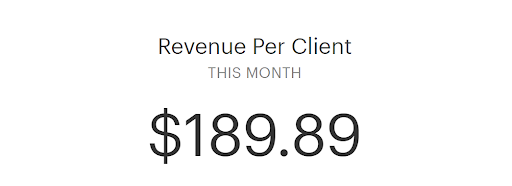
Looking at this screenshot from Upper Hand AI (which comes with a full suite of these KPIs) we can see that this business gets about 190 dollars in revenue per client. Depending on the kind of business that this example is taken from, this metric could mean a ton of different things. If it’s a small business that sells 200 dollar memberships as their primary revenue stream it means that they’re maybe not doing enough else to maximize the clients they have since it’s below the price of their flagship product.

Upper Hand, Inc. Acquires Leading Video Analysis Technology from Double Blue Sports Analytics, Inc. Press Statement INDIANAPOLIS – Upper Hand, Inc., the leader in cloud-based sports