
Imagine your coaching schedule staying the same, but your business continuing to grow. For many independent coaches, that shift feels impossible at first. But some

You don’t need to be a sports facility data scientist to do sports facility data analysis.
If you own a sports facility or manage the front desk of one, then you have likely heard of companies leveraging things like sports scheduling and analytics or sports facility management software to gain a competitive advantage. But have you thought about how facility intelligence might impact your business?
This type of sports business intelligence can give you an understanding of the trends occurring within your sports facility and the underlying data in your youth sports software CRM. So whether you already use your own custom-built sports software or are considering using companies like Upper Hand, I hope the following information will drive new ways of thinking about your sports facility. And ultimately, bring you additional revenue!
My goal is to help you cast a larger net to identify simple revenue opportunities by looking at how your current sports facility offering aligns with your current contact list. The result of this exercise will lead to one of a few possible outcomes, including the following:
With this kind of information, you can begin to understand how to target your sports facility to existing and new customers in a more efficient way.
After all, companies using analytics are 5x more likely to make faster decisions, leading to greater revenue. Unfortunately, 64% of business decision-makers say they have difficulty getting answers from their dashboard metrics.
Evolving your sports facility business model is not a new concept, but it is challenging. Yet, we still get to be a part of exciting stories like these as many of our customers have proven that you can grow your business this way. For example, House of Hustle unlocked new revenue streams with expanded membership offerings. Similarly, SpeedSkills Hockey introduced an entirely new product offering. And, EYG Basketball created efficiencies in their offering to improve the customer journey.
Let’s get started helping you better understand your sports facility business and unlock new growth opportunities with an introduction to sports business intelligence and a simple DIY exercise to highlight the power of sports business intelligence.
Some quick good news, nothing we share today requires any data science or machine learning expertise. Rather, I outline traditional data analyst techniques that any hard working business person can apply to their own sports facility.
Great business intelligence requires clean data and easy to understand visualizations.
To achieve this, start with a simple table of your own data. Or you can even try creating a fake dataset to test your techniques. The one I used for this analysis is called Mockaroo.com.
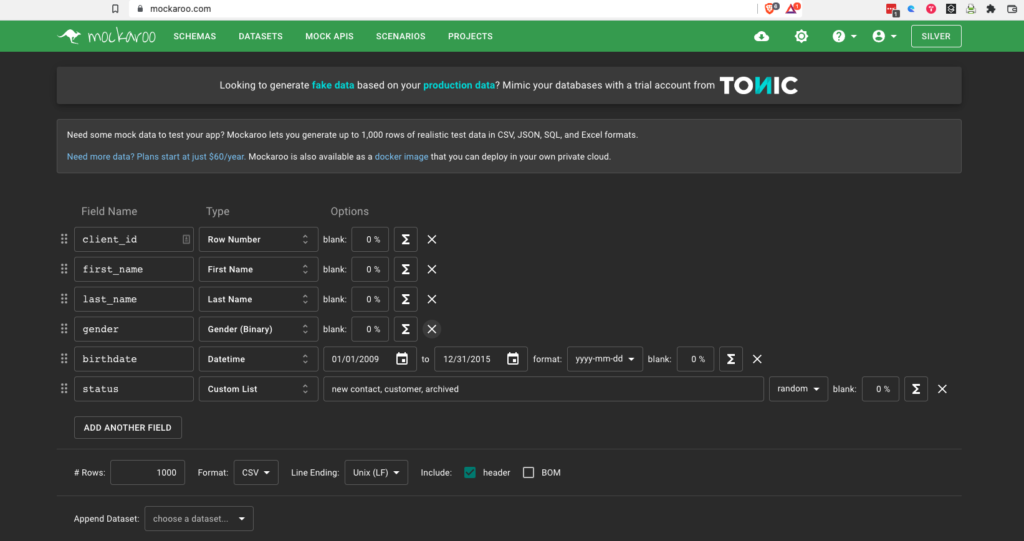
For this exercise, I create a 7 column sports facility CRM customer contact table with the following fields:
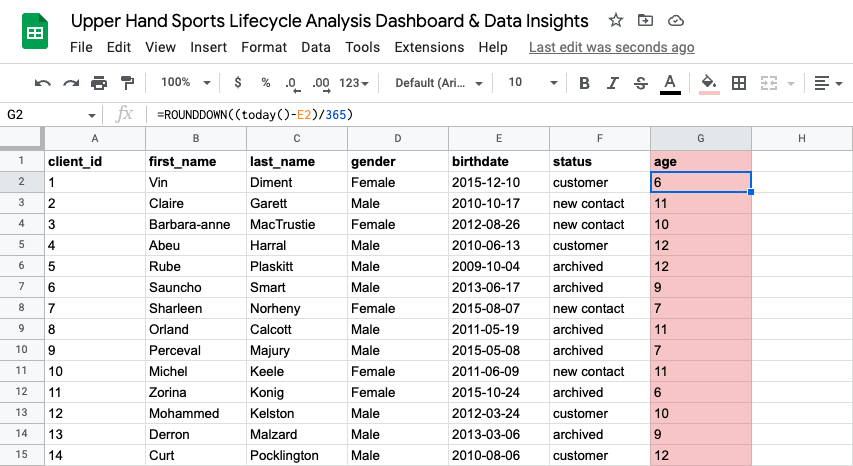
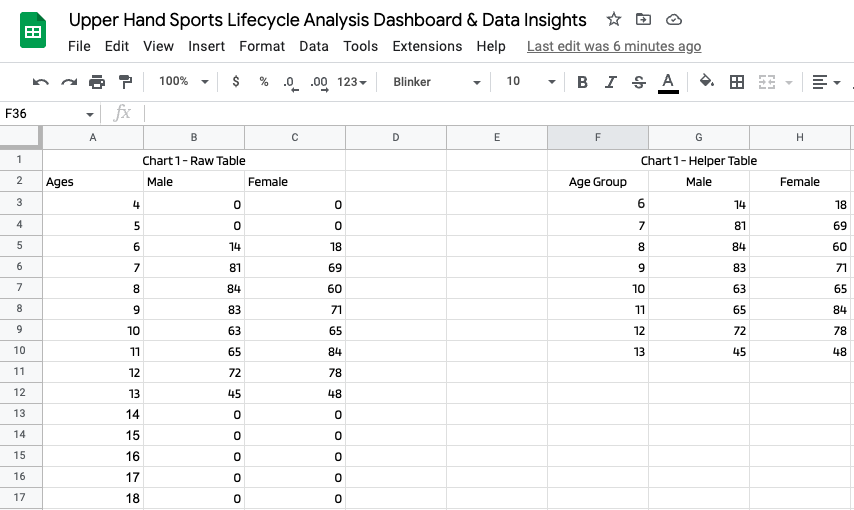
I then cleaned up the data to make it easy to create the visualizations, by creating a lookup table and a helper table to assist in filtering out any values equal to zero (otherwise the visualizations don’t look as nice). Don’t worry, here’s a link to the spreadsheet, so you can make a copy and make it your own.
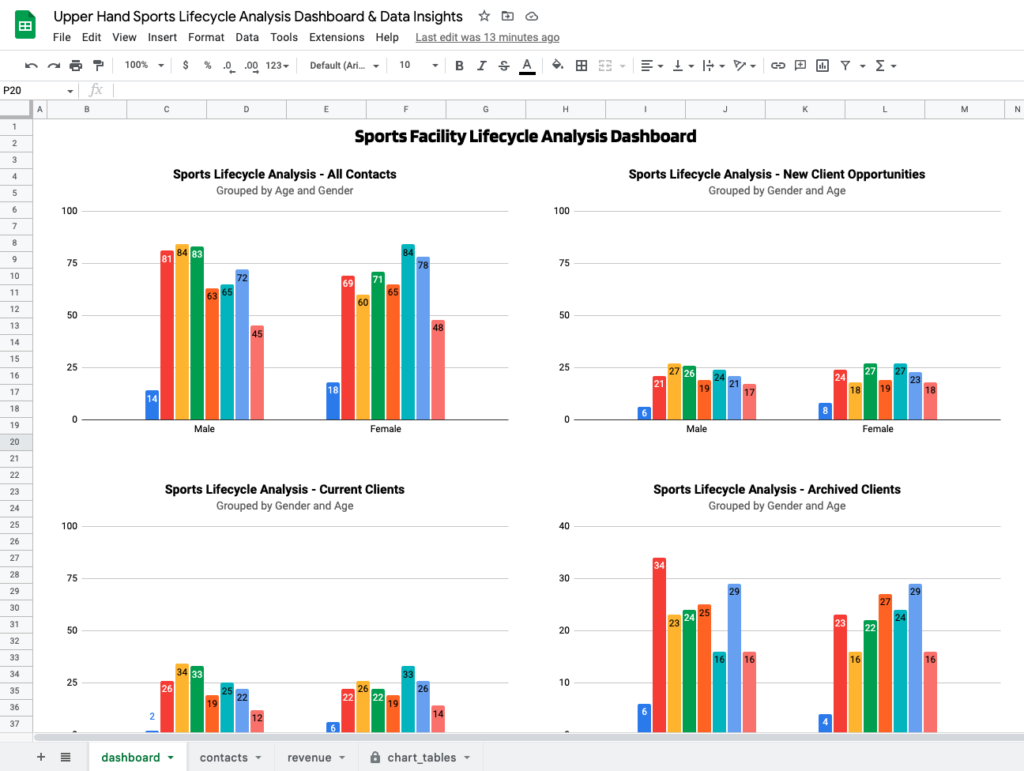
With my data ready, I created a simple dashboard of bar charts to analyze the lifecycle analysis of this fake sports facility dataset.
I created five simple bar charts that highlights the count of contacts per age group by gender. This helps me quickly see where our lifecycle of age groups are strongest and weakest. This sets up to answer my first question in the next step of this exercise.
The next step is to prepare the questions you would like to explore and analyze with your data. For example:
Whether you implement the analysis shared below or want to do your own data dive, it’s time-saving to know what question you are wanting to investigate and hopefully answer.
The below visualizations are about as simple as it gets and provide a great starting point for the health of your sports facility business pipeline by looking at new client opportunities alongside all contacts, which includes current customers, past customers and potential new customers.

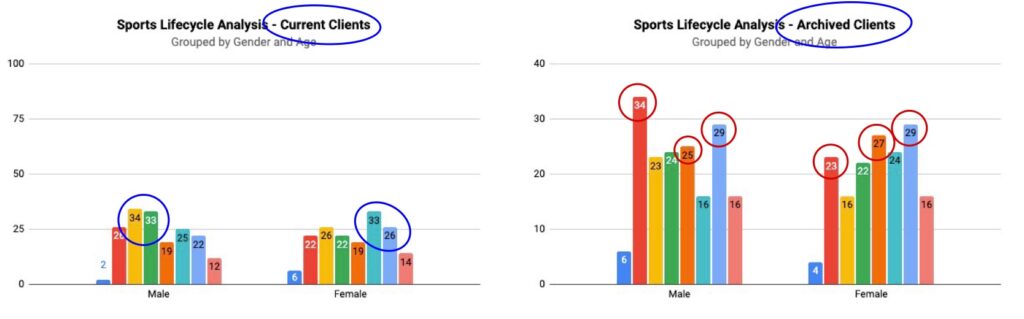
This sports facility appears to have a strong pipeline in the middle of the age groups with weakness on the front end of their lifecycle. And the quantity of new client opportunities is relatively spread out across the age groups, with similar weakness in the 6 year old age group as shown in the All Contacts chart.
Comparing our current offerings against the new client opportunities data, it is mission critical to make sure there are enough events available to satisfy this diverse client base. Otherwise, you risk losing out on potential revenue or worse, losing customers to another facility who can provide the services better aligned to their needs.
Within the current client and new opportunities, the largest age groups are 8 and 9 year old Males, and 11 and 12 year old Females. This is where the bulk of the product offering should be focused, and may represent new opportunities to add additional value for these athletes.
Are we losing too many 7, 10 and 12 year olds due to a lack of aligned athlete training offerings? Seeing these age groups as the highest in archived, lost clients, it would make sense to dig deeper into this. Reach out to a few of these clients to ask what they were looking for that they didn’t get from the facility’s offerings.
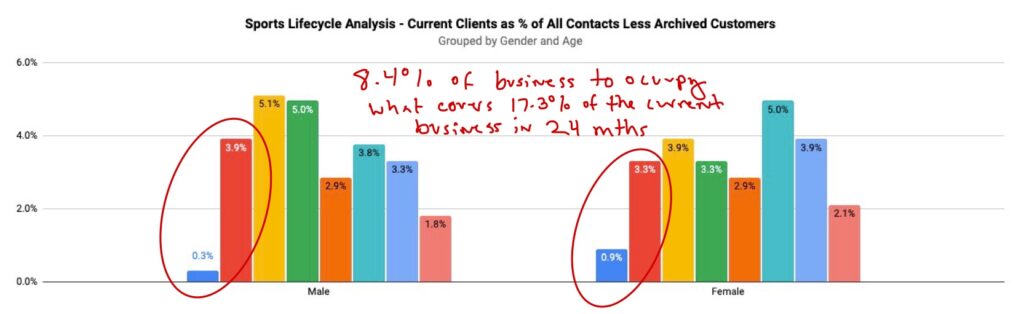
One of the greatest benefits of a sports facility business model is also one of its greatest challenges. Every year athletes “graduate” from training and a younger generation of athletes come in. This is good, as there is always a recycling of new opportunities in the market. But, it is potentially bad if a facility owner is not prepared to operate the business this way.
As shown above, only 8.4% of 6 and 7 year old clients are set to replace what covers 17.3% of the existing business in the 7 and 8 year old age groups. This is a potentially significant problem, unless the facility is prepared to push marketing efforts hard to fill the coming gaps in the front of their lifecycle.
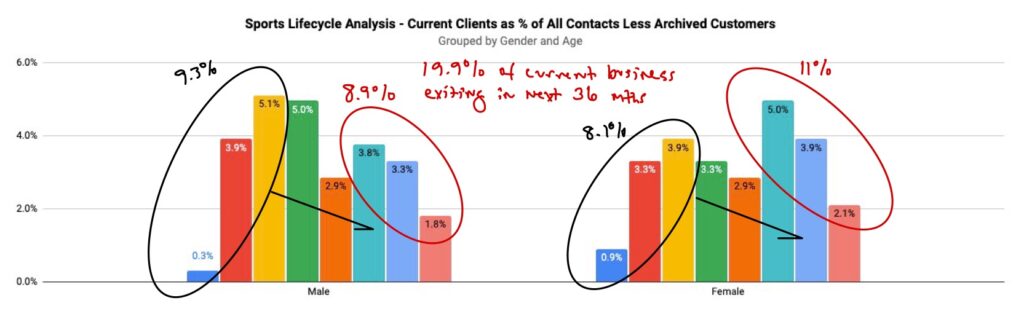
When looking at the ages nearing the end of the lifecycle compared to the ages at the beginning, 19.9% of the older athletes are set to graduate from the facility in the next 36 months. And they are currently replaced by only 17.4% of the younger athletes, leaving a 2.5% gap. This doesn’t sound like a big problem. But, for a facility operating on a $2m annual budget, they are on target to see a gap of $50,000 if they do not address this issue long term.
In each of the bar chart visualizations, it’s clear this sports facility has a decent distribution of clients across age groups. Knowing that, it would be beneficial for this facility to consider multi-age group events for their athletes to increase revenue through added value offerings.
Going from rags to riches is never easy. And, oftentimes, it’s a mythical version of a more realistic version of the same story. The reality of this story is that if data analysis as simple as shown here could add one offering to a facility that generates $100 more per month for as little as 25 clients, it would experience an increase of $30,000 in annual revenue. And odds are there is far greater potential in your real-life data.
I hope this has been insightful and helpful. And remember, data is useless if it is not usable and not used. And, only if data is used ethically and accurately. So dig out even the simplest contact data you have to get some initial insights.
You can use the following link to access the Upper Hand Sports Lifecycle Analysis Dashboard & Data Insights Google Sheet I put together. Simply make a copy of it and throw your own sports facility business data into it for a quick start.
And lastly, even if you are not able to get the time for this simple sports business analysis, you can at least start preparing for the future of data by making sure you are properly tracking and storing your data for when you do have time.

Imagine your coaching schedule staying the same, but your business continuing to grow. For many independent coaches, that shift feels impossible at first. But some

What is membership and payments software for sports facilities? Membership management & payment software helps sports facilities streamline how they sell, manage memberships, and track